Tableau Public Dashboard
Clicking the button below will open a new tab directing you to my Tableau Public Dashboard. Explore a collection of projects I've developed, showcasing my expertise and creativity!
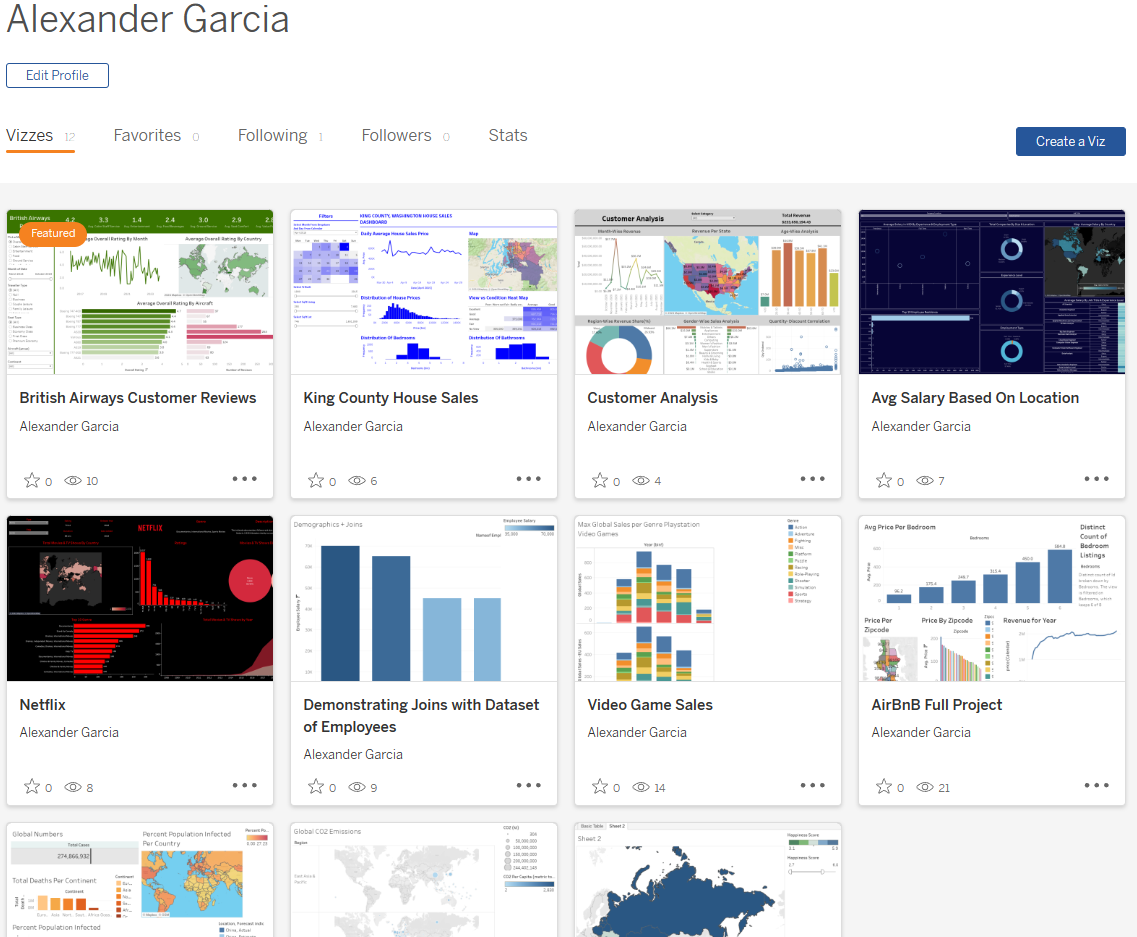
Data Analyst & Business Intelligence Expert | Proficient in Tableau, Power BI, SQL, Python | Experienced in ETL Processes & Data Visualization @AlexanderGarcia
Clicking the button below will open a new tab directing you to my Tableau Public Dashboard. Explore a collection of projects I've developed, showcasing my expertise and creativity!
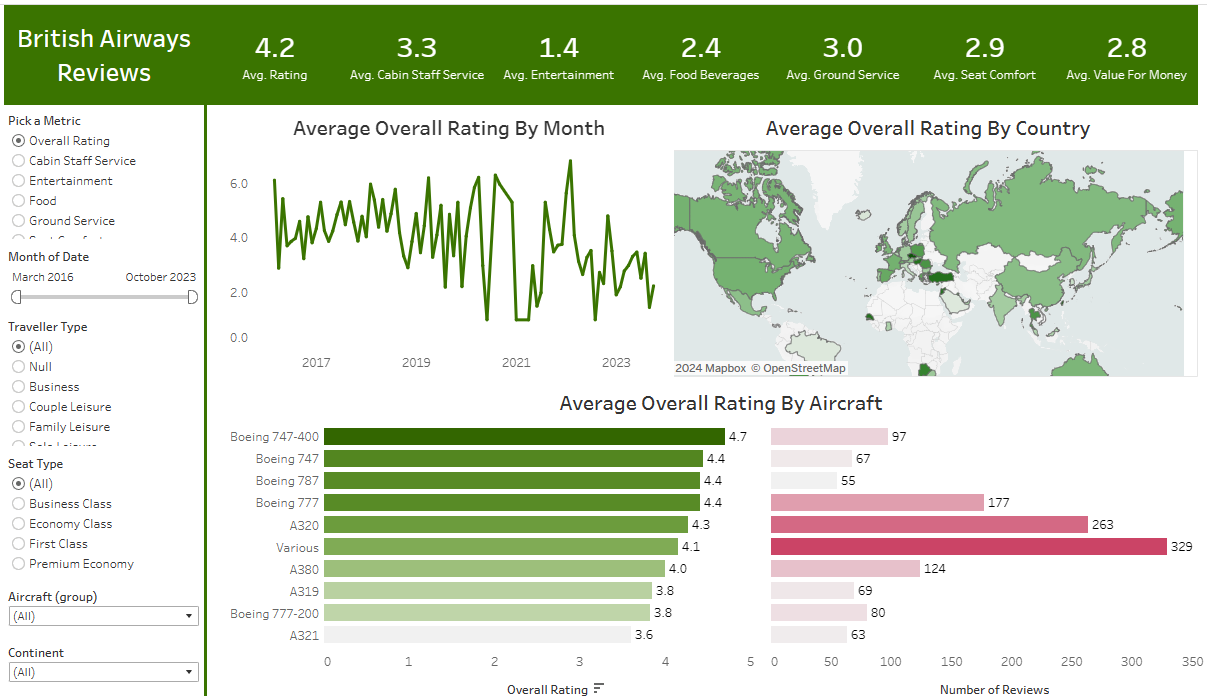
Developed dynamic views from British Airways customer reviews, enabling metric selection to gain insights into customer sentiment.
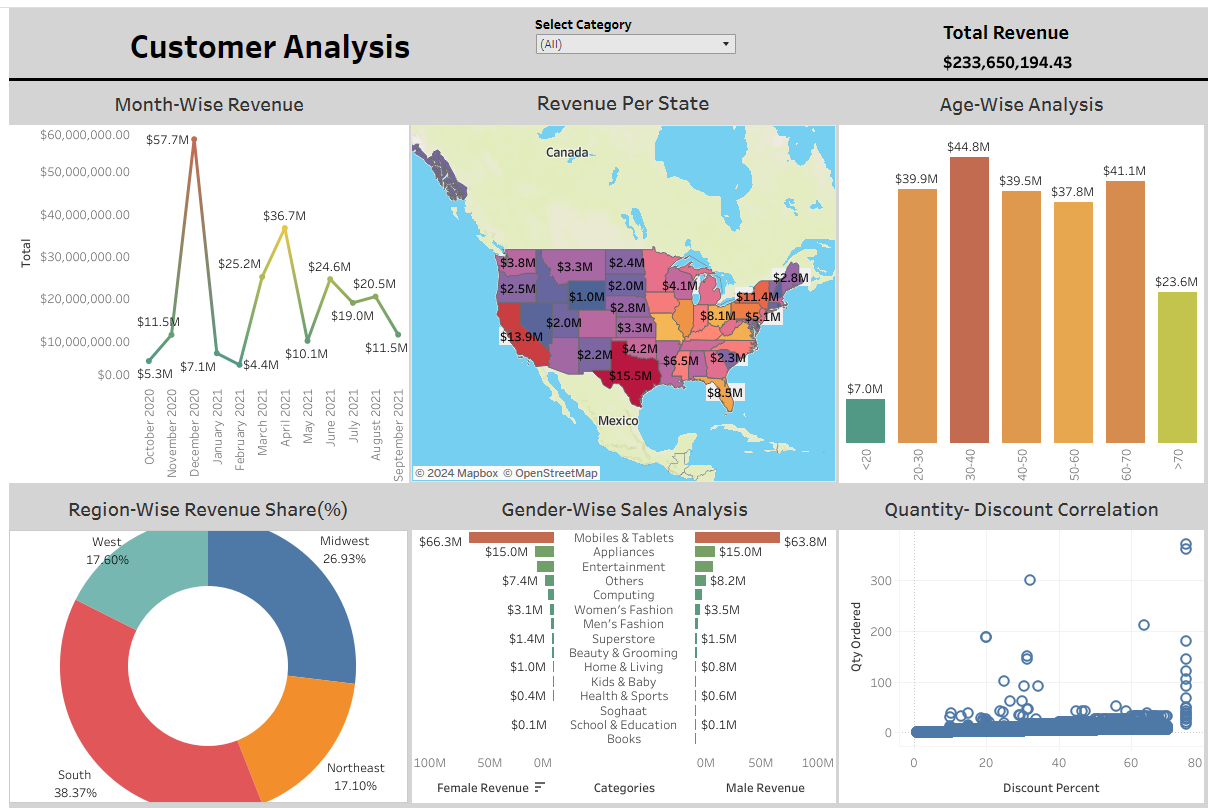
Explored diverse perspectives on customer revenue through customizable views, delving into factors like region and age.
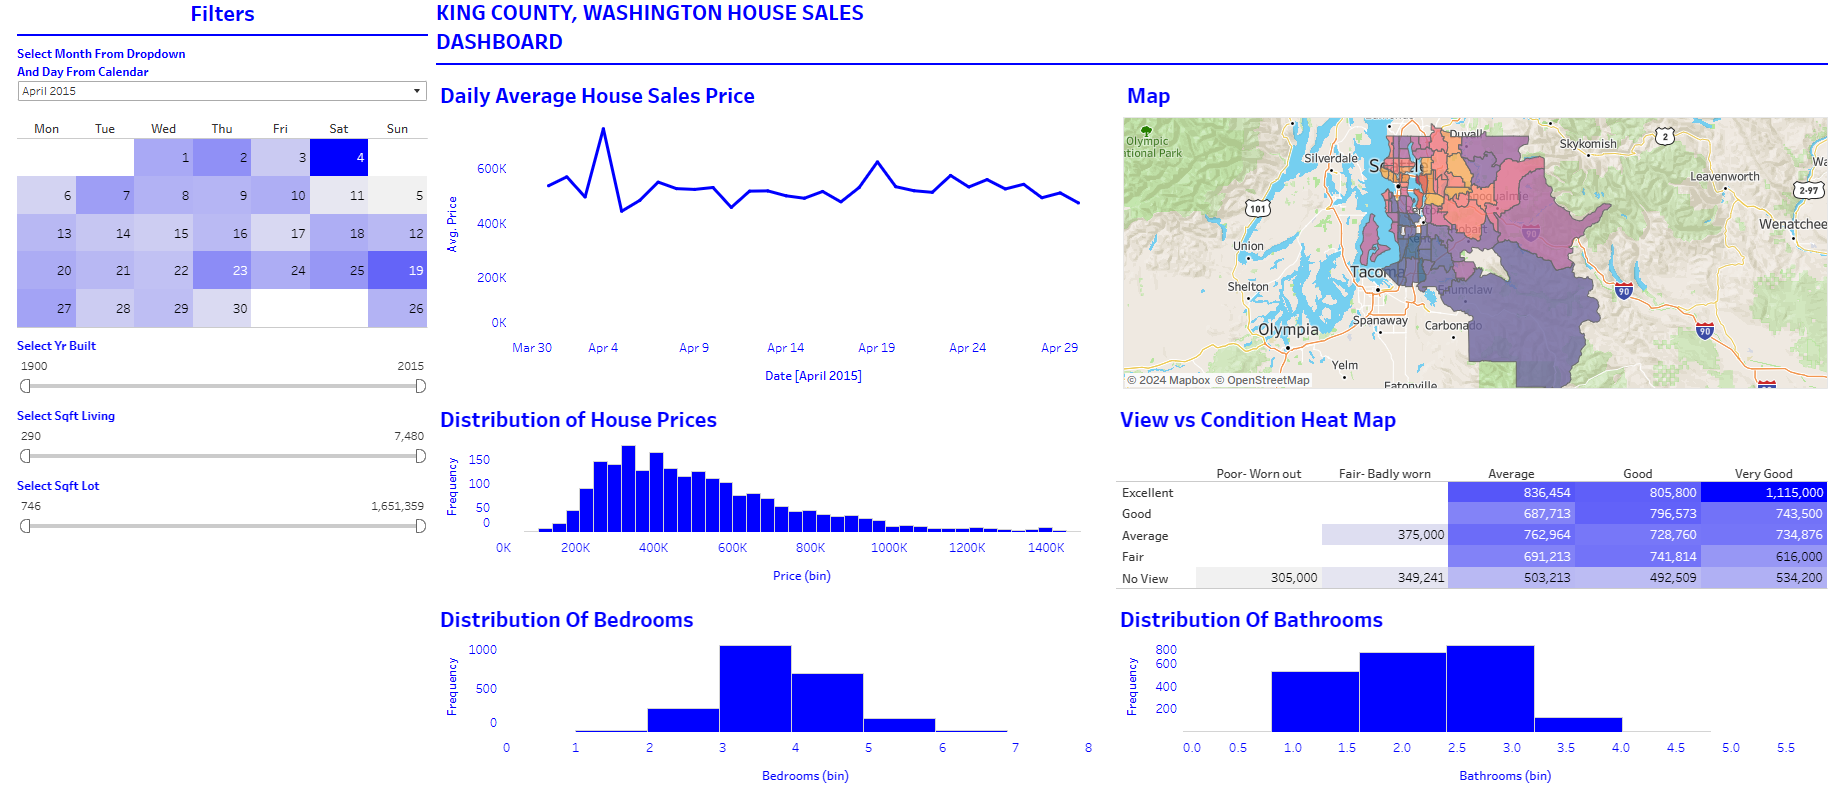
Enhanced dashboard functionality to analyze King County house sales, integrating advanced filters for pinpointing specific criteria like sale date and year built.
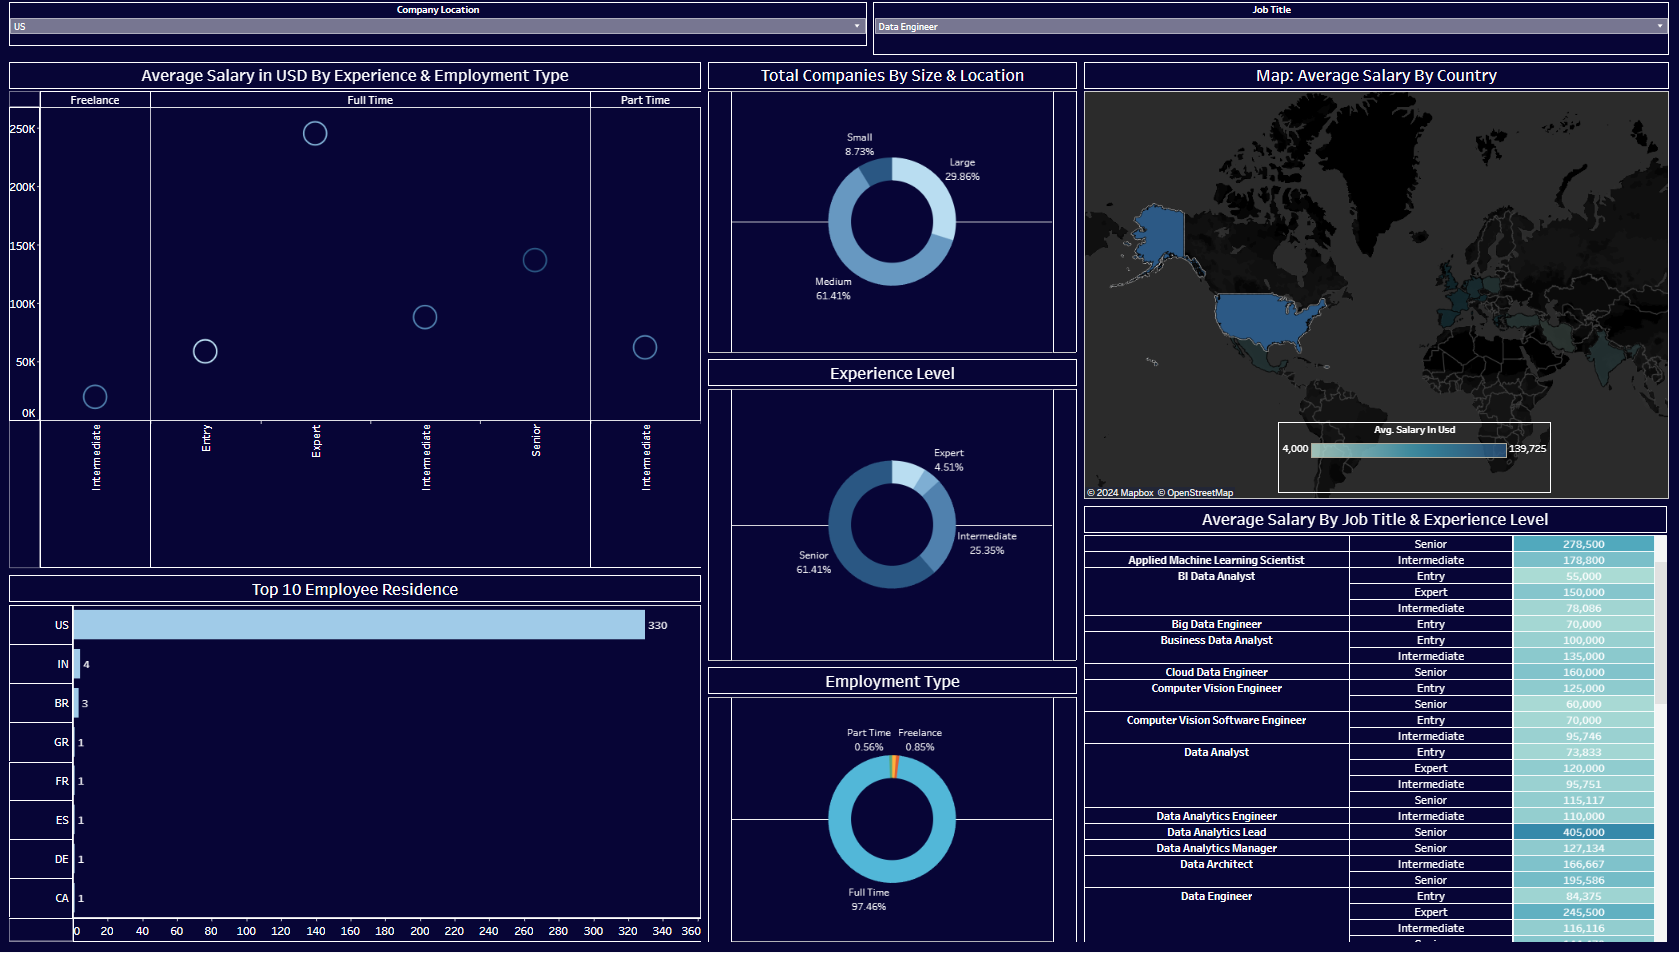
Created visual analytics to analyze average salary trends based on location, experience, employment type, and job title.
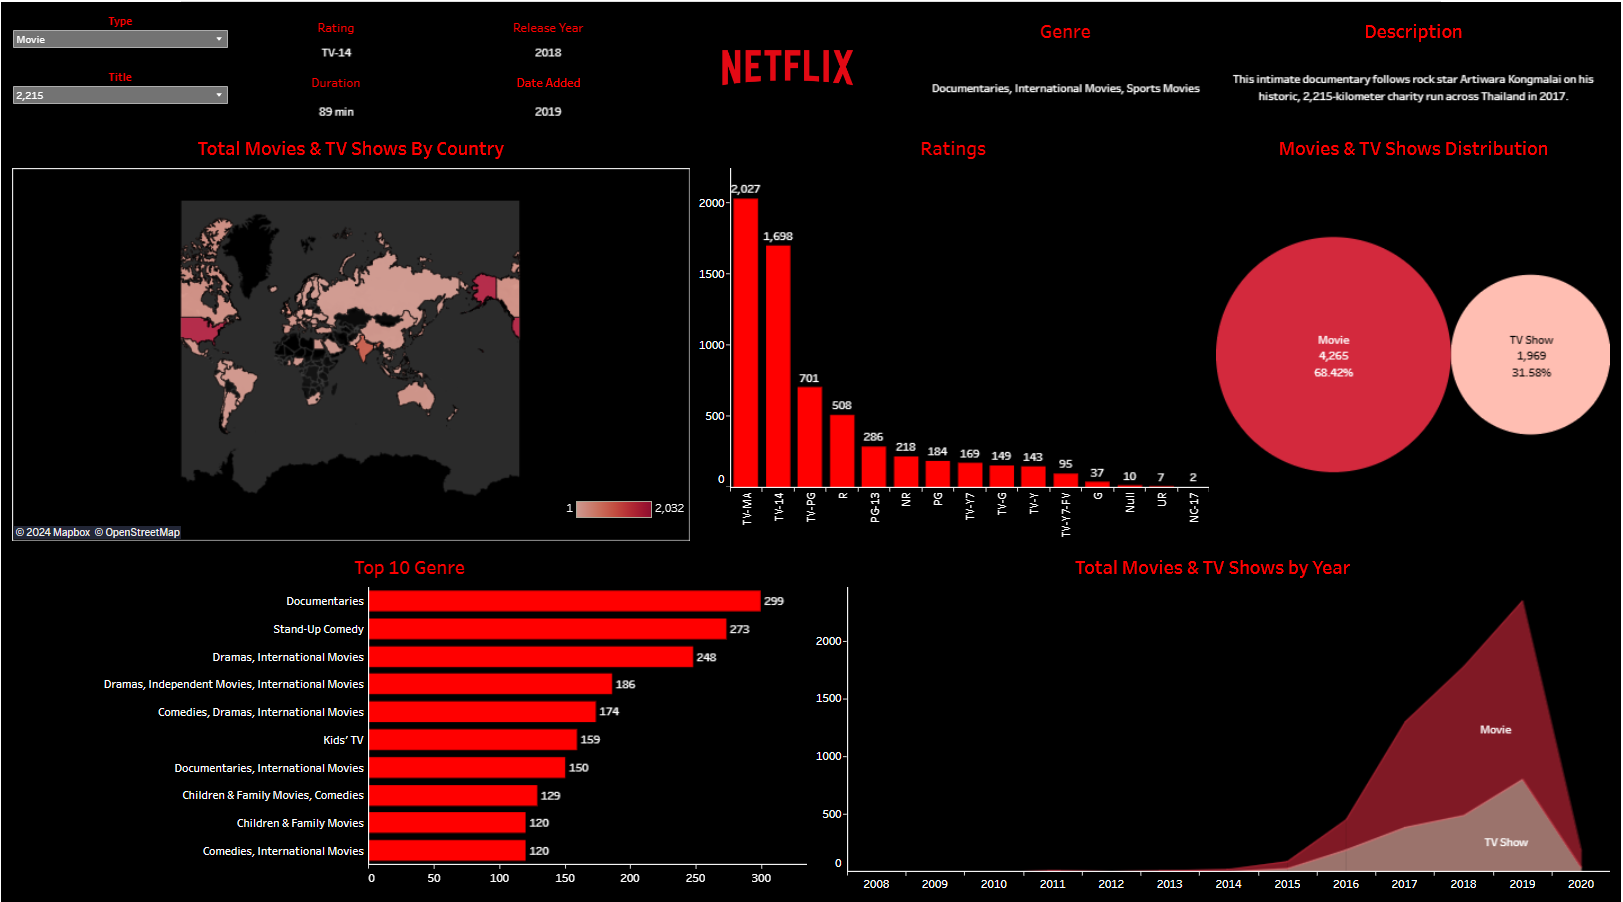
Developed a dashboard based on data from Netflix users' watch lists, showcasing top 10 genres and providing film descriptions upon selection.

Conducted comprehensive data exploration of the global COVID-19 dataset using SQL Server.
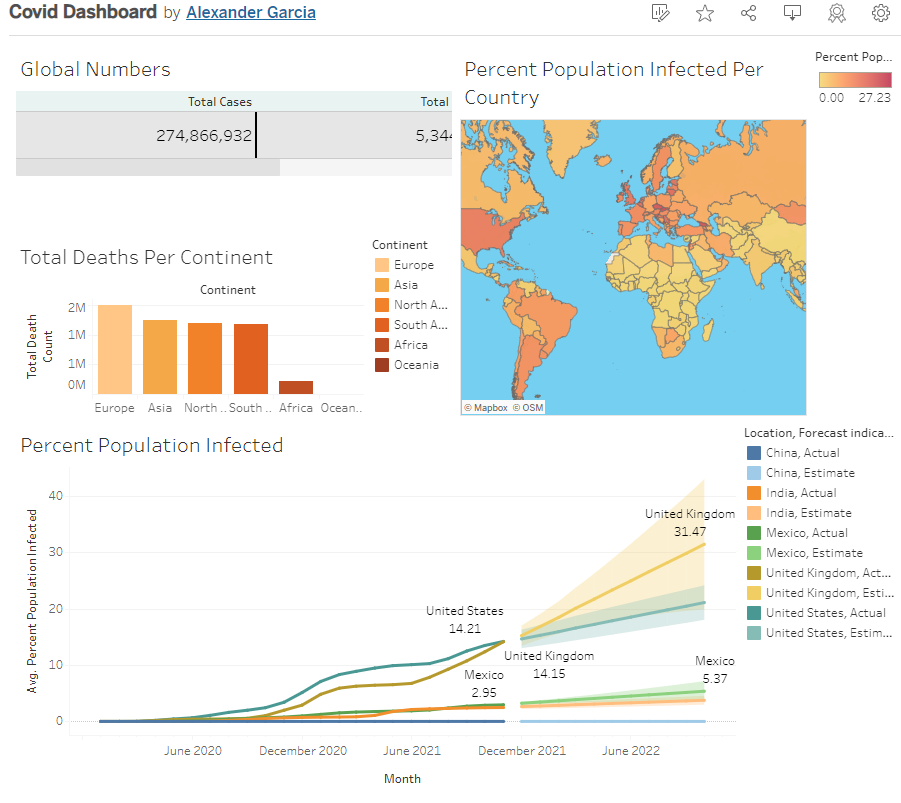
Utilized Tableau to visually represent global COVID-19 infection percentages.

Employed Python to uncover correlations among variables in a movie dataset, enhancing insights through statistical analysis.

Utilized the 2016 dataset to compare pricing trends of Airbnb listings in Seattle, providing valuable market insights.
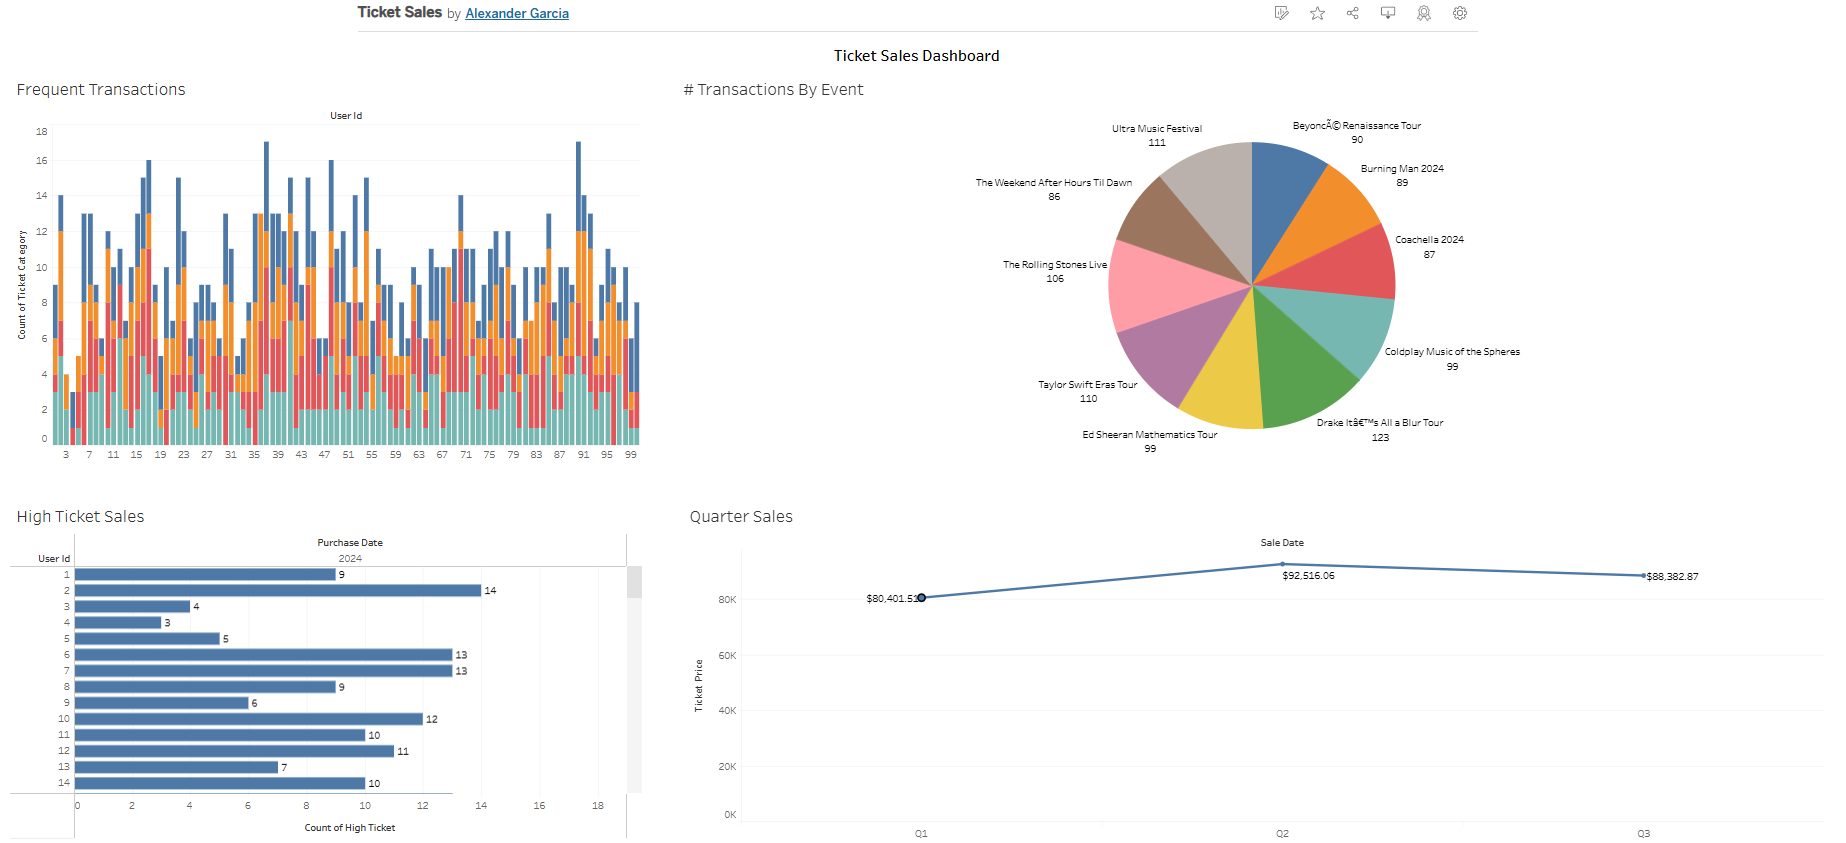
Utilized Python libraries to create a synthetic dataset of ticket sales to showcase a quick dashboard of views.